County ProfileWI
Grant County
Population: 51,938 · 22 ZIP codes
Demographics
Source: U.S. Census Bureau (ACS/Decennial). Estimates vary by year.
People
Total population
51,938
People
Median age
36.8
Housing
Total households
19,960
Income
Median household income
$66,858
Housing
Total housing units
22,332
Employment
Employment rate
61.4%
Education
Bachelor’s degree or higher
25.6%
Healthcare
Insured population
92%
County details
Local time 02:17:11(CT)| Name | Grant |
|---|---|
| Total ZIP codes | 22total |
| ZIP codes (by type) | 18 Standard4 PO Box |
| Area code | 608 |
| Timezone | Central Time (CT) |
| Coordinates | 42.8700275, -90.6942288 |
| Land area | 1,147.6 sq miles(2,972.3 km²) |
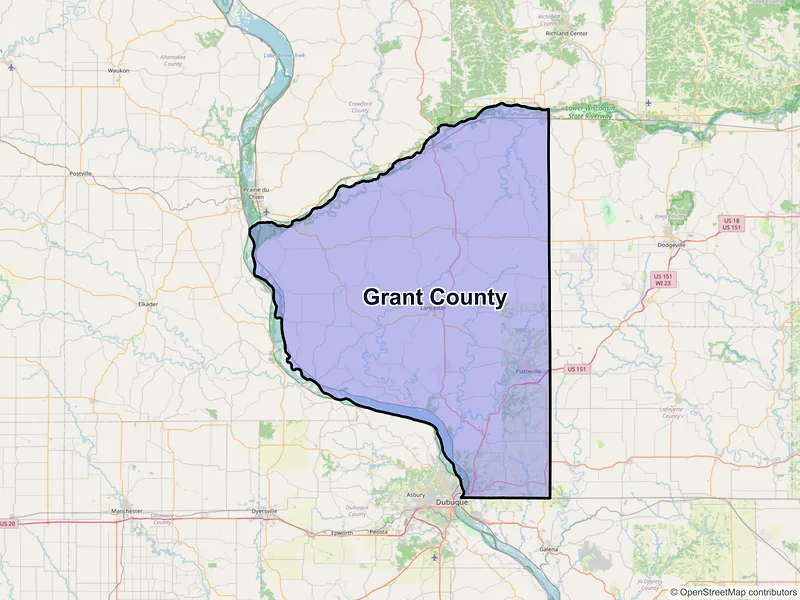
Map of Grant county, Wisconsin with ZIP codes
Cities and Communities in Grant County
Compare the largest cities in Grant County by population, median income, and growth. Use the table below to analyze key demographic shifts across the region.
| City | Population | Median incomeHousehold | ZIP codes |
|---|---|---|---|
| Platteville | 11,836 | $43,083 | 1ZIPs |
| Lancaster | 3,907 | $84,302 | 1ZIPs |
| Boscobel | 3,286 | $54,071 | 1ZIPs |
| Fennimore | 2,764 | $61,875 | 1ZIPs |
| Cuba City | 2,138 | $74,571 | 1ZIPs |
| Muscoda | 1,307 | $55,833 | 1ZIPs |
| Hazel Green | 1,173 | $64,688 | 1ZIPs |
| Dickeyville | 1,015 | $70,913 | 1ZIPs |
| Cassville | 777 | $58,750 | 1ZIPs |
| Bloomington | 741 | $77,750 | 1ZIPs |
| Montfort | 705 | $90,000 | 1ZIPs |
| Potosi | 646 | $69,000 | 1ZIPs |
| Livingston | 637 | $66,875 | 1ZIPs |
| Kieler | 557 | $78,750 | 1ZIPs |
| Stitzer | 495 | — | 1ZIPs |
| Blue River | 457 | $59,861 | 1ZIPs |
| Bagley | 356 | $53,229 | 1ZIPs |
| Mount Hope | 215 | $64,063 | 1ZIPs |
| Patch Grove | 201 | $48,958 | 1ZIPs |
| Woodman | 118 | $83,438 | 1ZIPs |
| Beetown | 64 | — | 1ZIPs |
| Glen Haven | 64 | $71,250 | 1ZIPs |
— Data unavailable or suppressed by the U.S. Census Bureau for areas with small sample sizes to protect individual privacy.
ZIP Codes in Grant County
Review the most populated postal areas across Grant County. Use the ranking below to compare resident density and demographic scales between the county's major zones.
| ZIP | City | Median incomeHousehold | Population (ZIP) |
|---|---|---|---|
| 53818 | Platteville | $55,567 | 15,786 |
| 53813 | Lancaster | $84,004 | 6,267 |
| 53805 | Boscobel | $60,870 | 5,395 |
| 53807 | Cuba City | $77,887 | 4,565 |
| 53809 | Fennimore | $65,568 | 4,409 |
| 53811 | Hazel Green | $82,769 | 3,213 |
| 53573 | Muscoda | $64,776 | 3,018 |
| 53820 | Potosi | $77,083 | 2,421 |
| 53806 | Cassville | $64,076 | 1,577 |
| 53518 | Blue River | $62,384 | 1,411 |
| 53804 | Bloomington | $82,917 | 1,353 |
| 53569 | Montfort | $89,500 | 1,147 |
| 53554 | Livingston | $74,063 | 1,093 |
| 53808 | Dickeyville | $70,913 | 1,041 |
| 53801 | Bagley | $65,357 | 842 |
| 53816 | Mount Hope | $71,250 | 815 |
| 53825 | Stitzer | $102,500 | 495 |
| 53810 | Glen Haven | $75,500 | 424 |
| 53812 | Kieler | $80,833 | 406 |
| 53827 | Woodman | $81,607 | 291 |
Data Sources & Citations
The geographic and demographic information presented on this site is compiled from publicly available, authoritative sources, including:
- United States Census BureauDemographic, population, housing, and socioeconomic data sourced from Census Bureau datasets, including the Decennial Census and the American Community Survey (ACS).Census Data
- United States Postal Service (USPS)ZIP code classifications, delivery types, and postal designations used for reference purposes. USPS ZIP codes are intended for mail delivery and may not always align exactly with Census geographic boundaries.USPS