County ProfileIL
Cook County
Population: 5,275,541 · 216 ZIP codes
Demographics
Source: U.S. Census Bureau (ACS/Decennial). Estimates vary by year.
People
Total population
5,275,541
People
Median age
38
Housing
Total households
2,100,230
Income
Median household income
$83,498
Housing
Total housing units
2,276,493
Employment
Employment rate
61.5%
Education
Bachelor’s degree or higher
42.7%
Healthcare
Insured population
91.1%
County details
Local time 02:46:33(CT)| Name | Cook |
|---|---|
| Total ZIP codes | 216total |
| ZIP codes (by type) | 166 Standard24 PO Box26 Unique |
| Area code | 224, 312, 331, 464, 630, 708, 773, 779, 815, 847, 872 |
| Timezone | Central Time (CT) |
| Coordinates | 41.8942937, -87.6454546 |
| Land area | 944.9 sq miles(2,447.4 km²) |
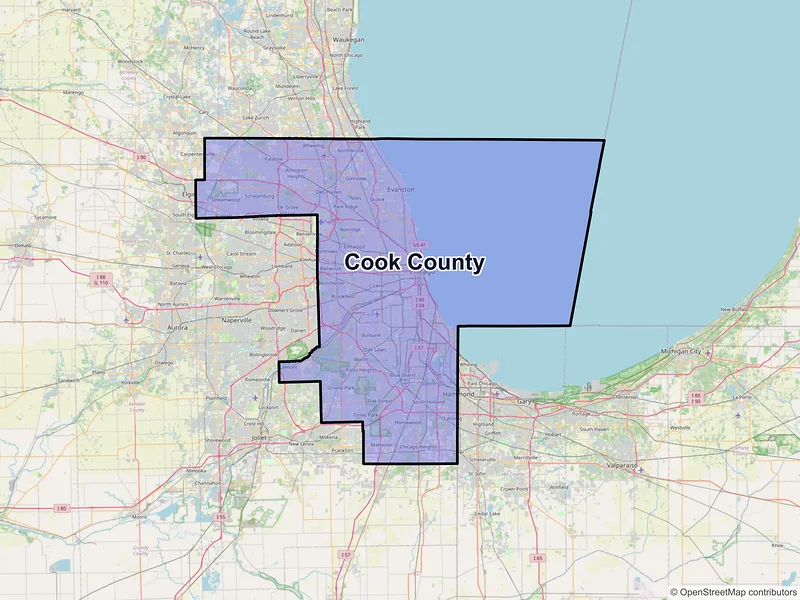
Map of Cook county, Illinois with ZIP codes
Cities and Communities in Cook County
Compare the largest cities in Cook County by population, median income, and growth. Use the table below to analyze key demographic shifts across the region.
| City | Population | Median incomeHousehold | ZIP codes |
|---|---|---|---|
| Chicago | 2,746,388 | $77,902 | 84ZIPs |
| Cicero | 85,268 | $70,842 | 1ZIPs |
| Schaumburg | 78,723 | $97,514 | 7ZIPs |
| Evanston | 78,110 | $96,434 | 5ZIPs |
| Arlington Heights | 77,676 | $116,723 | 3ZIPs |
| Palatine | 67,908 | $97,819 | 7ZIPs |
| Skokie | 67,824 | $95,337 | 2ZIPs |
| Des Plaines | 60,675 | $97,875 | 4ZIPs |
| Orland Park | 58,703 | $98,910 | 2ZIPs |
| Oak Lawn | 58,362 | $83,911 | 2ZIPs |
| Berwyn | 57,250 | $78,408 | 1ZIPs |
| Mount Prospect | 56,852 | $101,720 | 1ZIPs |
| Tinley Park | 55,971 | $105,189 | 2ZIPs |
| Oak Park | 54,583 | $110,820 | 4ZIPs |
| Hoffman Estates | 52,530 | $106,806 | 3ZIPs |
| Glenview | 48,705 | $143,056 | 2ZIPs |
| Park Ridge | 39,656 | $142,986 | 1ZIPs |
| Streamwood | 39,577 | $101,218 | 1ZIPs |
| Wheeling | 39,137 | $85,205 | 1ZIPs |
| Hanover Park | 37,470 | $91,763 | 1ZIPs |
| Calumet City | 36,033 | $55,369 | 1ZIPs |
| Northbrook | 35,222 | $157,782 | 2ZIPs |
| Elk Grove Village | 32,812 | $94,175 | 2ZIPs |
| Niles | 30,912 | $75,274 | 1ZIPs |
| Burbank | 29,439 | $80,116 | 1ZIPs |
| Lansing | 29,076 | $75,569 | 1ZIPs |
| Wilmette | 28,170 | $190,662 | 1ZIPs |
| Chicago Heights | 27,480 | $54,798 | 2ZIPs |
| Oak Forest | 27,478 | $91,990 | 1ZIPs |
| Morton Grove | 25,297 | $111,116 | 1ZIPs |
| Melrose Park | 24,796 | $66,189 | 3ZIPs |
| Elmwood Park | 24,521 | $91,955 | 1ZIPs |
| Rolling Meadows | 24,200 | $98,514 | 1ZIPs |
| Maywood | 23,512 | $68,815 | 1ZIPs |
| Blue Island | 22,558 | $59,489 | 1ZIPs |
| Park Forest | 21,687 | $61,072 | 1ZIPs |
| South Holland | 21,465 | $85,280 | 1ZIPs |
| Dolton | 21,426 | $57,887 | 1ZIPs |
| Harvey | 20,324 | $42,429 | 1ZIPs |
| Evergreen Park | 19,943 | $95,719 | 1ZIPs |
| Brookfield | 19,476 | $110,295 | 1ZIPs |
| Homewood | 19,463 | $100,139 | 1ZIPs |
| Matteson | 19,073 | $95,457 | 1ZIPs |
| Alsip | 19,063 | $66,585 | 1ZIPs |
| Bellwood | 18,789 | $79,513 | 1ZIPs |
| Palos Hills | 18,530 | $83,533 | 1ZIPs |
| Franklin Park | 18,467 | $76,519 | 1ZIPs |
| Lemont | 17,629 | $123,370 | 1ZIPs |
| Bridgeview | 17,027 | $66,655 | 1ZIPs |
| Westchester | 16,892 | $98,954 | 1ZIPs |
| Country Club Hills | 16,775 | $75,197 | 1ZIPs |
| La Grange | 16,321 | $159,929 | 1ZIPs |
| Prospect Heights | 16,058 | $85,008 | 1ZIPs |
| Hickory Hills | 14,505 | $77,262 | 1ZIPs |
| Chicago Ridge | 14,433 | $68,964 | 1ZIPs |
| Forest Park | 14,339 | $77,221 | 1ZIPs |
| Midlothian | 14,325 | $70,000 | 1ZIPs |
| Western Springs | 13,629 | $230,255 | 1ZIPs |
| La Grange Park | 13,475 | $120,408 | 1ZIPs |
| Lincolnwood | 13,463 | $109,731 | 1ZIPs |
| Hazel Crest | 13,382 | $68,393 | 1ZIPs |
| Richton Park | 12,775 | $64,554 | 1ZIPs |
| Winnetka | 12,744 | $250,001 | 1ZIPs |
| Justice | 12,600 | $57,170 | 1ZIPs |
| Palos Heights | 12,068 | $108,740 | 1ZIPs |
| Summit Argo | 11,746 | — | 1ZIPs |
| River Forest | 11,717 | $146,786 | 1ZIPs |
| Schiller Park | 11,709 | $69,696 | 1ZIPs |
| Markham | 11,661 | $57,302 | 1ZIPs |
| Worth | 10,970 | $56,288 | 1ZIPs |
| Crestwood | 10,826 | $75,752 | 1ZIPs |
| Lyons | 10,817 | $70,993 | 1ZIPs |
| Barrington | 10,722 | $147,989 | 2ZIPs |
| Riverdale | 10,663 | $39,833 | 1ZIPs |
| River Grove | 10,612 | $69,858 | 1ZIPs |
| Flossmoor | 9,704 | $133,663 | 1ZIPs |
| Steger | 9,584 | $66,575 | 1ZIPs |
| Riverside | 9,298 | $153,686 | 1ZIPs |
| Harwood Heights | 9,065 | $81,086 | 1ZIPs |
| Glencoe | 8,849 | $248,933 | 1ZIPs |
| Glenwood | 8,662 | $77,391 | 1ZIPs |
| Hillside | 8,320 | $72,320 | 1ZIPs |
| Broadview | 7,998 | $64,697 | 1ZIPs |
| Willow Springs | 5,857 | $103,583 | 1ZIPs |
| Posen | 5,632 | $73,051 | 1ZIPs |
| Berkeley | 5,338 | $85,823 | 1ZIPs |
| Palos Park | 4,899 | $121,696 | 1ZIPs |
| Olympia Fields | 4,718 | $123,875 | 1ZIPs |
| Robbins | 4,629 | $40,668 | 1ZIPs |
| Stone Park | 4,576 | $67,224 | 1ZIPs |
| Hometown | 4,343 | $61,101 | 1ZIPs |
| Kenilworth | 2,514 | $250,001 | 1ZIPs |
| Thornton | 2,386 | $59,647 | 1ZIPs |
| Bedford Park | 602 | $99,000 | 1ZIPs |
| Golf | 514 | $242,772 | 1ZIPs |
| Hines | 131 | — | 1ZIPs |
— Data unavailable or suppressed by the U.S. Census Bureau for areas with small sample sizes to protect individual privacy.
ZIP Codes in Cook County
Review the most populated postal areas across Cook County. Use the ranking below to compare resident density and demographic scales between the county's major zones.
| ZIP | City | Median incomeHousehold | Population (ZIP) |
|---|---|---|---|
| 60629 | Chicago | $60,826 | 114,453 |
| 60632 | Chicago | $64,809 | 92,237 |
| 60618 | Chicago | $106,384 | 90,316 |
| 60639 | Chicago | $61,089 | 89,543 |
| 60623 | Chicago | $51,878 | 87,649 |
| 60804 | Cicero | $70,842 | 85,673 |
| 60647 | Chicago | $107,060 | 85,631 |
| 60617 | Chicago | $51,778 | 77,270 |
| 60625 | Chicago | $85,703 | 76,525 |
| 60608 | Chicago | $73,366 | 75,770 |
| 60634 | Chicago | $88,533 | 75,694 |
| 60614 | Chicago | $136,448 | 73,173 |
| 60657 | Chicago | $110,939 | 72,316 |
| 60641 | Chicago | $83,758 | 69,354 |
| 60620 | Chicago | $48,146 | 66,514 |
| 60640 | Chicago | $73,254 | 65,941 |
| 60609 | Chicago | $58,896 | 65,770 |
| 60402 | Berwyn | $77,718 | 64,706 |
| 60619 | Chicago | $45,206 | 63,303 |
| 60628 | Chicago | $54,644 | 62,832 |
Data Sources & Citations
The geographic and demographic information presented on this site is compiled from publicly available, authoritative sources, including:
- United States Census BureauDemographic, population, housing, and socioeconomic data sourced from Census Bureau datasets, including the Decennial Census and the American Community Survey (ACS).Census Data
- United States Postal Service (USPS)ZIP code classifications, delivery types, and postal designations used for reference purposes. USPS ZIP codes are intended for mail delivery and may not always align exactly with Census geographic boundaries.USPS