County ProfileCA
San Mateo County
Population: 764,442 · 36 ZIP codes
Demographics
Source: U.S. Census Bureau (ACS/Decennial). Estimates vary by year.
People
Total population
764,442
People
Median age
40.9
Housing
Total households
264,419
Income
Median household income
$158,855
Housing
Total housing units
287,184
Employment
Employment rate
64%
Education
Bachelor’s degree or higher
53.7%
Healthcare
Insured population
96.2%
County details
Local time 22:53:43(PT)| Name | San Mateo |
|---|---|
| Total ZIP codes | 36total |
| ZIP codes (by type) | 27 Standard8 PO Box1 Unique |
| Area code | 415, 628, 650 |
| Timezone | Pacific Time (PT) |
| Coordinates | 37.4146725, -122.3715457 |
| Land area | 448.6 sq miles(1,161.9 km²) |
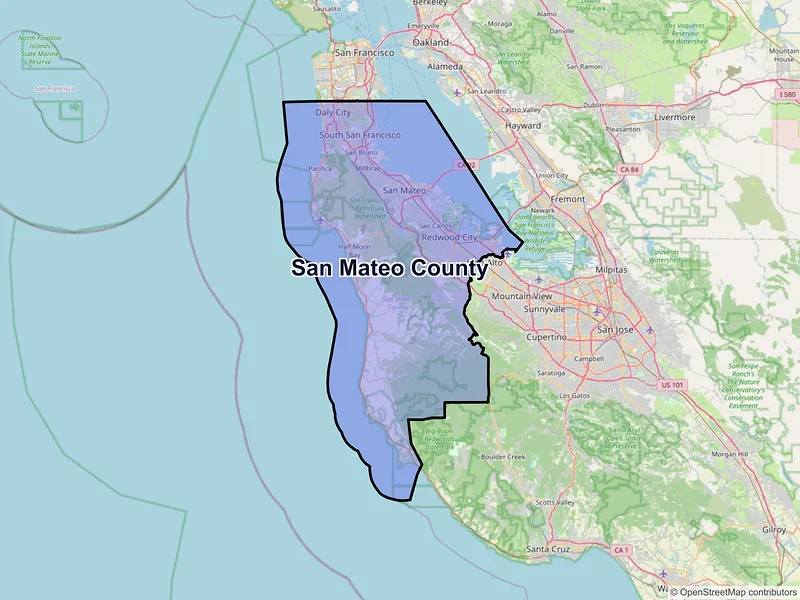
Map of San Mateo county, California with ZIP codes
Cities and Communities in San Mateo County
Compare the largest cities in San Mateo County by population, median income, and growth. Use the table below to analyze key demographic shifts across the region.
| City | Population | Median incomeHousehold | ZIP codes |
|---|---|---|---|
| San Mateo | 105,661 | $153,504 | 5ZIPs |
| Daly City | 104,901 | $123,547 | 4ZIPs |
| Redwood City | 84,292 | $157,814 | 5ZIPs |
| South San Francisco | 66,105 | $136,578 | 2ZIPs |
| San Bruno | 43,908 | $141,272 | 1ZIPs |
| Pacifica | 38,640 | $160,523 | 1ZIPs |
| Menlo Park | 33,780 | $210,025 | 2ZIPs |
| Burlingame | 31,386 | $174,000 | 2ZIPs |
| San Carlos | 30,722 | $237,470 | 1ZIPs |
| Belmont | 28,335 | $205,297 | 1ZIPs |
| Millbrae | 23,216 | $163,476 | 1ZIPs |
| Half Moon Bay | 11,795 | $157,884 | 1ZIPs |
| Atherton | 7,188 | $250,001 | 1ZIPs |
| El Granada | 5,481 | $213,347 | 1ZIPs |
| Brisbane | 4,851 | $156,169 | 1ZIPs |
| Portola Valley | 4,456 | $250,001 | 1ZIPs |
| Moss Beach | 3,214 | $99,680 | 1ZIPs |
| Montara | 2,833 | $233,826 | 1ZIPs |
| La Honda | 979 | $250,001 | 1ZIPs |
| Pescadero | 595 | $250,001 | 1ZIPs |
| San Gregorio | 282 | — | 1ZIPs |
| Loma Mar | 134 | $250,001 | 1ZIPs |
— Data unavailable or suppressed by the U.S. Census Bureau for areas with small sample sizes to protect individual privacy.
ZIP Codes in San Mateo County
Review the most populated postal areas across San Mateo County. Use the ranking below to compare resident density and demographic scales between the county's major zones.
| ZIP | City | Median incomeHousehold | Population (ZIP) |
|---|---|---|---|
| 94080 | South San Francisco | $136,733 | 66,592 |
| 94015 | Daly City | $127,056 | 63,489 |
| 94014 | Daly City | $122,966 | 48,677 |
| 94403 | San Mateo | $174,917 | 45,057 |
| 94066 | San Bruno | $141,272 | 44,147 |
| 94010 | Burlingame | $196,882 | 44,045 |
| 94025 | Menlo Park | $216,601 | 42,354 |
| 94044 | Pacifica | $160,408 | 38,675 |
| 94404 | San Mateo | $192,332 | 37,323 |
| 94061 | Redwood City | $146,265 | 36,704 |
| 94063 | Redwood City | $116,760 | 35,836 |
| 94401 | San Mateo | $122,227 | 35,249 |
| 94070 | San Carlos | $240,074 | 31,585 |
| 94002 | Belmont | $203,965 | 28,513 |
| 94062 | Redwood City | $233,262 | 26,689 |
| 94402 | San Mateo | $172,522 | 25,879 |
| 94030 | Millbrae | $163,476 | 23,212 |
| 94019 | Half Moon Bay | $153,781 | 15,483 |
| 94065 | Redwood City | $215,955 | 12,781 |
| 94027 | Atherton | $250,001 | 7,270 |
Data Sources & Citations
The geographic and demographic information presented on this site is compiled from publicly available, authoritative sources, including:
- United States Census BureauDemographic, population, housing, and socioeconomic data sourced from Census Bureau datasets, including the Decennial Census and the American Community Survey (ACS).Census Data
- United States Postal Service (USPS)ZIP code classifications, delivery types, and postal designations used for reference purposes. USPS ZIP codes are intended for mail delivery and may not always align exactly with Census geographic boundaries.USPS