County ProfileAZ
Yavapai County
Population: 236,209 · 41 ZIP codes
Demographics
Source: U.S. Census Bureau (ACS/Decennial). Estimates vary by year.
People
Total population
236,209
People
Median age
55.1
Housing
Total households
111,157
Income
Median household income
$69,613
Housing
Total housing units
126,095
Employment
Employment rate
46.1%
Education
Bachelor’s degree or higher
30.3%
Healthcare
Insured population
89.9%
County details
Local time 22:53:31(MST)| Name | Yavapai |
|---|---|
| Total ZIP codes | 41total |
| ZIP codes (by type) | 24 Standard17 PO Box |
| Area code | 623, 928 |
| Timezone | Mountain Standard Time (MST) |
| Coordinates | 34.631071, -112.5772247 |
| Land area | 8,122.9 sq miles(21,038.3 km²) |
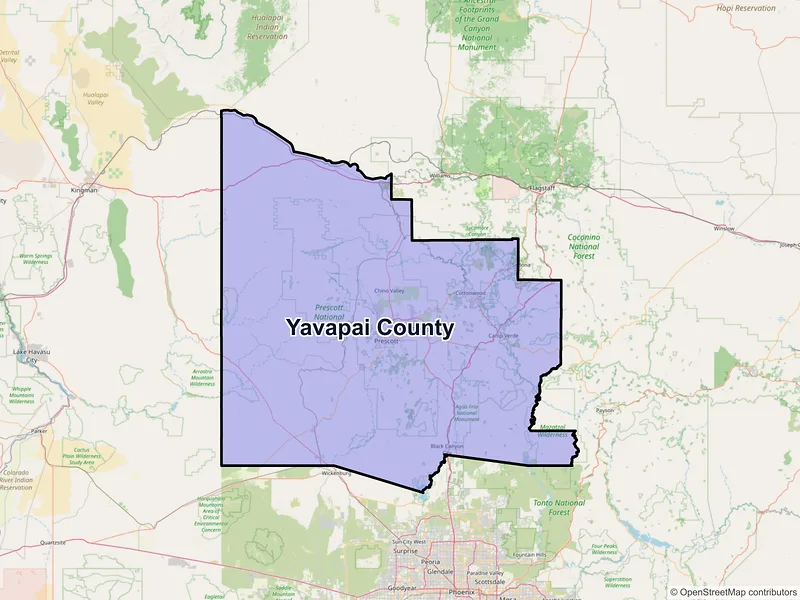
Map of Yavapai county, Arizona with ZIP codes
Cities and Communities in Yavapai County
Compare the largest cities in Yavapai County by population, median income, and growth. Use the table below to analyze key demographic shifts across the region.
| City | Population | Median incomeHousehold | ZIP codes |
|---|---|---|---|
| Peoria | 190,985 | $95,815 | 6ZIPs |
| Prescott Valley | 46,785 | $74,569 | 3ZIPs |
| Prescott | 45,827 | $70,874 | 6ZIPs |
| Chino Valley | 13,020 | $61,237 | 1ZIPs |
| Camp Verde | 12,147 | $69,203 | 1ZIPs |
| Cottonwood | 12,029 | $48,448 | 1ZIPs |
| Sedona | 9,684 | $73,738 | 5ZIPs |
| Paulden | 5,567 | $91,741 | 1ZIPs |
| Rimrock | 5,229 | — | 1ZIPs |
| Lake Montezuma | 5,111 | $64,455 | 1ZIPs |
| Clarkdale | 4,424 | $46,563 | 1ZIPs |
| Dewey-Humboldt | 4,326 | $66,535 | 2ZIPs |
| Cornville | 3,362 | $72,596 | 1ZIPs |
| Black Canyon City | 2,677 | $47,465 | 1ZIPs |
| Bagdad | 1,932 | $107,885 | 1ZIPs |
| Congress | 1,811 | $57,159 | 1ZIPs |
| Kirkland | 1,716 | — | 1ZIPs |
| Mayer | 1,558 | $55,132 | 1ZIPs |
| Skull Valley | 587 | — | 1ZIPs |
| Yarnell | 570 | $47,609 | 1ZIPs |
| Jerome | 464 | $40,096 | 1ZIPs |
| Seligman | 446 | $51,875 | 1ZIPs |
| Ash Fork | 361 | $48,563 | 1ZIPs |
| Crown King | 88 | — | 1ZIPs |
— Data unavailable or suppressed by the U.S. Census Bureau for areas with small sample sizes to protect individual privacy.
ZIP Codes in Yavapai County
Review the most populated postal areas across Yavapai County. Use the ranking below to compare resident density and demographic scales between the county's major zones.
| ZIP | City | Median incomeHousehold | Population (ZIP) |
|---|---|---|---|
| 85383 | Peoria | $145,546 | 69,617 |
| 85345 | Peoria | $67,380 | 61,024 |
| 85382 | Peoria | $91,525 | 42,576 |
| 86314 | Prescott Valley | $69,208 | 39,461 |
| 85381 | Peoria | $96,746 | 27,008 |
| 86301 | Prescott | $72,652 | 25,115 |
| 86326 | Cottonwood | $57,378 | 24,465 |
| 86305 | Prescott | $80,436 | 19,555 |
| 86323 | Chino Valley | $62,603 | 18,422 |
| 86303 | Prescott | $72,359 | 18,201 |
| 86322 | Camp Verde | $69,411 | 12,696 |
| 86327 | Dewey-Humboldt | $71,512 | 11,530 |
| 86336 | Sedona | $68,435 | 11,125 |
| 86315 | Prescott Valley | $97,049 | 10,354 |
| 86351 | Sedona | $81,203 | 6,398 |
| 86333 | Mayer | $55,602 | 5,886 |
| 86325 | Cornville | $74,679 | 5,472 |
| 86334 | Paulden | $78,723 | 5,261 |
| 86335 | Rimrock | $64,455 | 5,229 |
| 86324 | Clarkdale | $46,813 | 4,544 |
Data Sources & Citations
The geographic and demographic information presented on this site is compiled from publicly available, authoritative sources, including:
- United States Census BureauDemographic, population, housing, and socioeconomic data sourced from Census Bureau datasets, including the Decennial Census and the American Community Survey (ACS).Census Data
- United States Postal Service (USPS)ZIP code classifications, delivery types, and postal designations used for reference purposes. USPS ZIP codes are intended for mail delivery and may not always align exactly with Census geographic boundaries.USPS